2016-10-03 (95fb490)
1 Getting Started
This chapter will walk you through a simple experiment on PhantomNet and introduce you to some of its basic concepts.
Start by pointing your browser at https://www.phantomnet.org/.
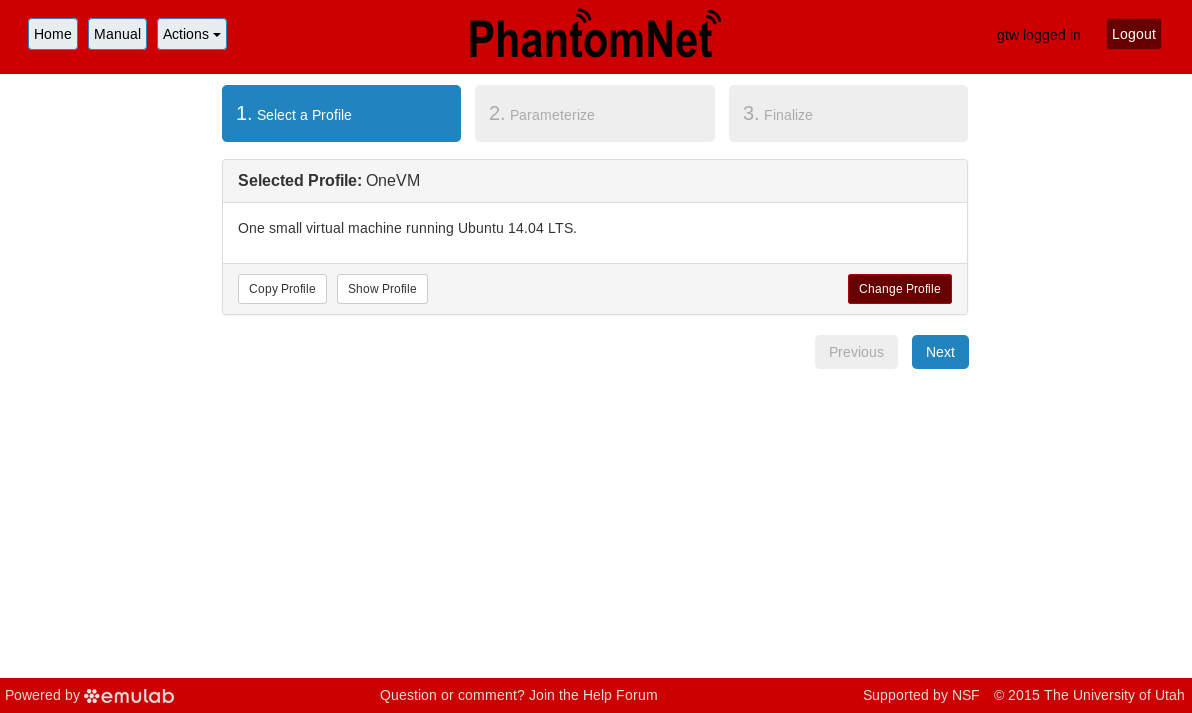
- Select a profileClicking the “Change Profile” button will let you select the profile that your experiment will be built from. A profile describes a set of resources (both hardware and software) that will be used to start your experiment. On the hardware side, the profile will control whether you get virtual machines or physical ones, how many there are, and what the network between them looks like. On the software side, the profile specifies the operating system and installed software.Profiles come from two sources. Some of them are provided by PhantomNet itself, and provide standard installation of popular operating systems, software stacks, etc. Others are created by other researchers and may contain research software, artifacts and data used to gather published results, etc. Profiles represent a powerful way to enable repeatable research.The large display in this dialog box shows the network topology of the profile, and a short description sits below the topology view.
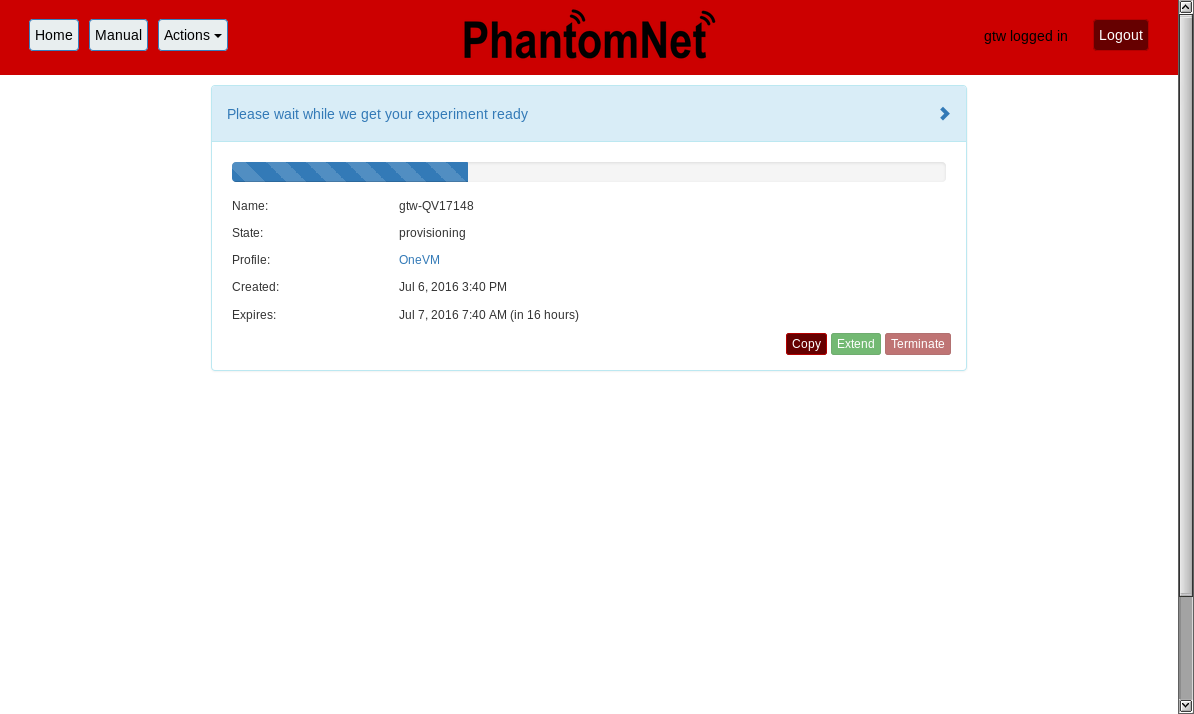
- Click Create!When you click the “Create” button, PhantomNet will start preparing your experiment by selecting nodes, installing software, etc. as described in the profile. What’s going on behind the scenes is that on one (or more) of the machines in one of the PhantomNet clusters, a disk is being imaged, VMs and/or physical machines booted, accounts created for you, etc. This process usually takes a couple of minutes.
- Use your experimentWhen your experiment is ready to use, the progress bar will be complete, and you’ll be given a lot of new options at the bottom of the screen.
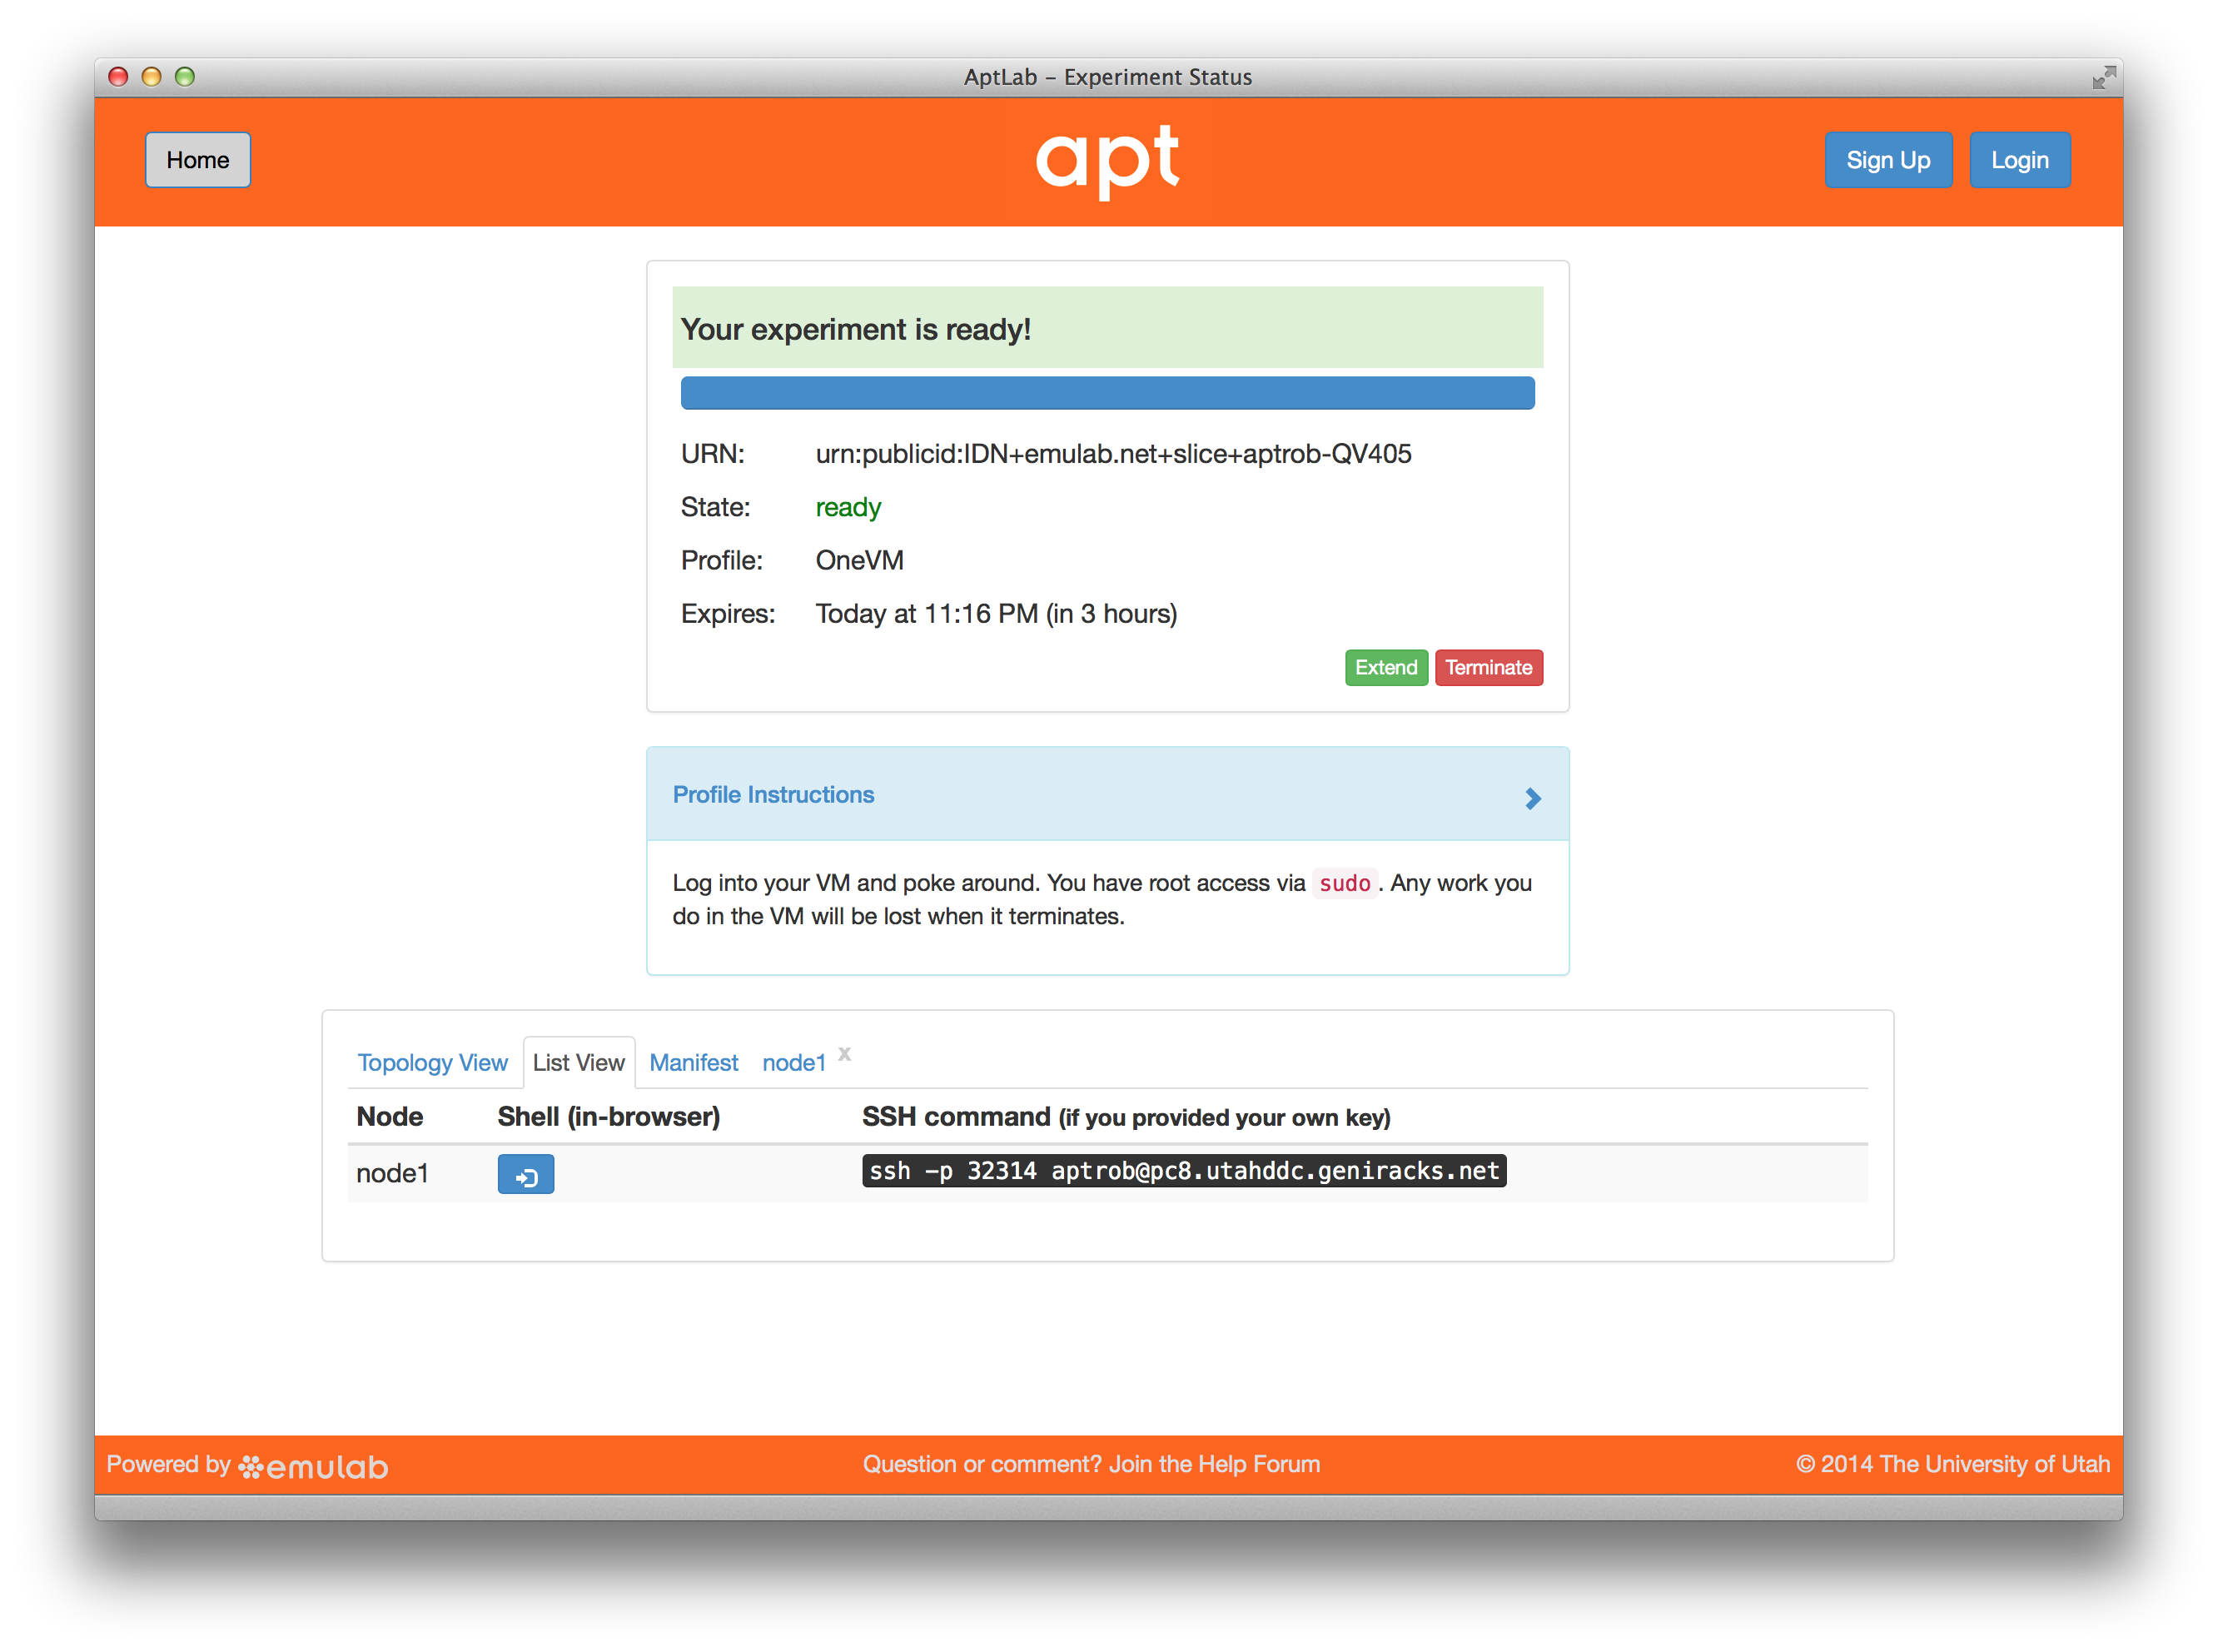 The “Topology View” shows the network topology of your experiment (which may be as simple as a single node). Clicking on a node in this view brings up a terminal in your browser that gives you a shell on the node. The “List View” lists all nodes in the topology, and in addition to the in-browser shell, gives you the command to ssh login to the node (if you provided a public key). The “Manifest” tab shows you the technical details of the resources allocated to your experiment. Any open terminals you have to the nodes show up as tabs on this page.Clicking on the “Profile Instructions” link (if present) will show instructions provided by the profile’s creator regarding its use.Your experiment is yours alone, and you have full “root” access (via the sudo command). No one else has access to the nodes in your experiment, and you may do anything at all inside of it, up to and including making radical changes to the operating system itself. We’ll clean it all up when you’re done!Your experiment will terminate automatically after a few hours. When the experiment terminates, you will lose anything on disk on the nodes, so be sure to copy off anything important early and often. You can use the “Extend” button to submit a request to hold it longer, or the “Terminate” button to end it early.
1.1 Next Steps
Making your own profiles is easy: see the chapter on profile creation for instructions.
If you need help, or have questions or comments about PhantomNet’s features, contact us!